Latest News
Our Mission
The Regional Cooperation Council serves regional cooperation and Euro-Atlantic integration of South East Europe, in order to spark development in the region to the benefit of its people
Spotlight
Spotlight
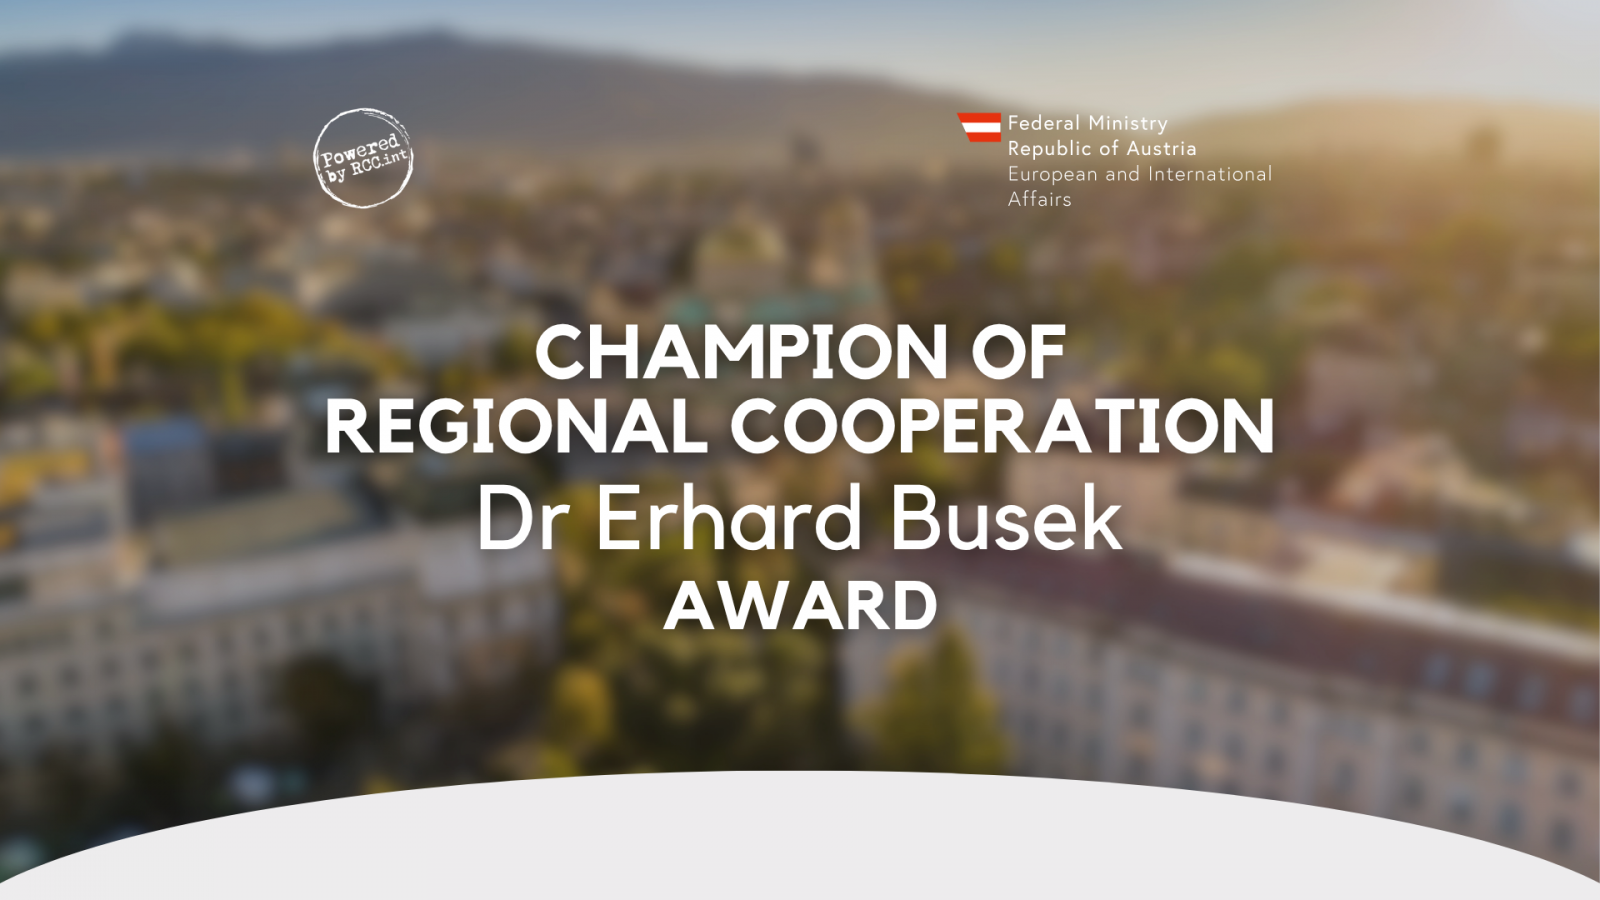
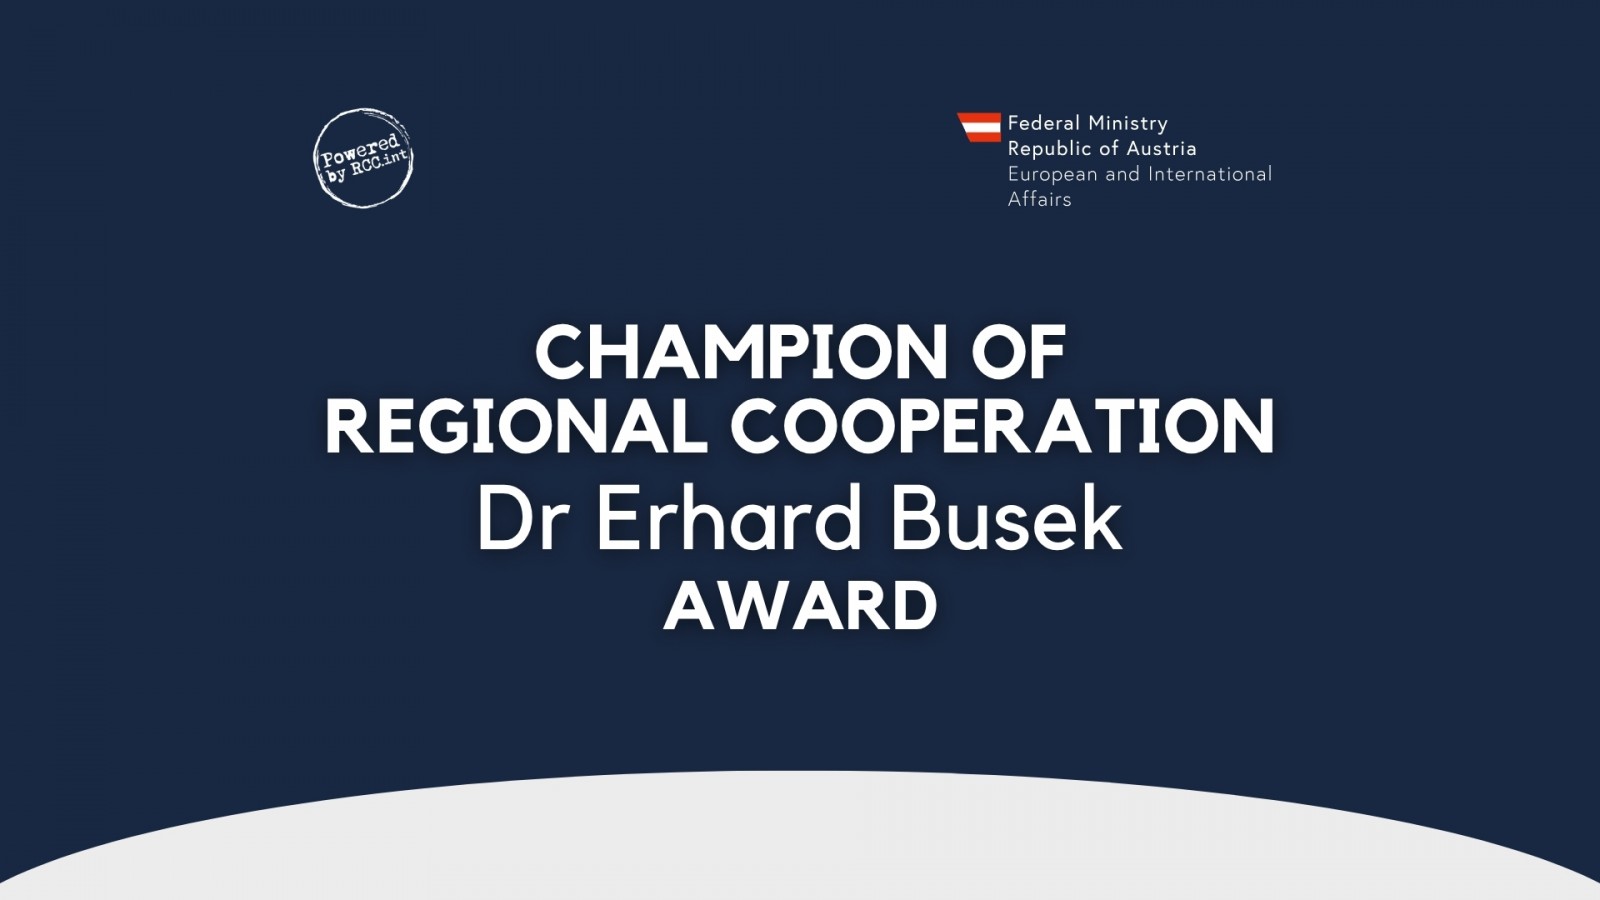
Nominations

Database
database
Network
Results / Outputs
Did you know?


What we do
Helping prosperity and growth through regional action in South East Europe, while supporting European and Euro-Atlantic integration, is what the Regional Cooperation Council is all about. We see our region as a place of dialogue, freedom and mobility, rich in cultural heritage, where each person feels safe and protected by the rule of law.

Digital Transformation
Connecting the region

Human Capital
Unlocking the potential

Green Agenda
Greening the future

Competitiveness
Lifting economy barriers

Security Cooperation
Towards safe and secure region

Regional Coordination
Driving collaborative progress in South East Europe


Campaigns See all